Root Cause Fishbone Diagram Template
Download a Blank Root Cause Fishbone Diagram Template in
Microsoft Word
|
Adobe PDF
| Google Docs
Download an Example Root Cause Fishbone Diagram Template in
Microsoft Word
|
Adobe PDF
| Google Docs
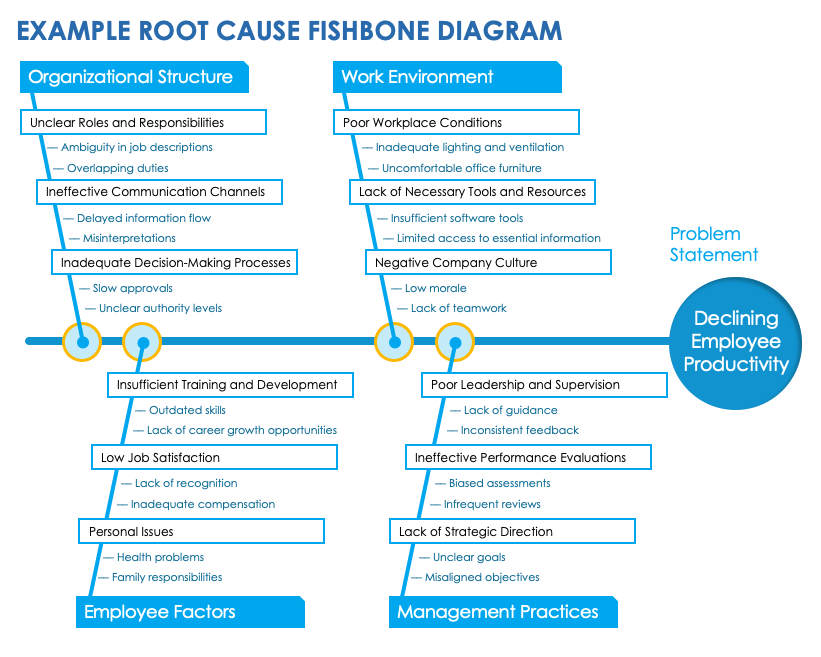
When to Use This Template: Project managers can use this template with or without sample data to identify and categorize the root causes of complex problems. Explore these causes to troubleshoot and strategize solutions for management challenges and other issues.
Notable Template Features: The template divides causes into four categories, making it easy to pinpoint where issues originate. Each category branches out into more specific factors for a comprehensive analysis. The example version of this template shows a filled-out diagram analyzing decreases in employee productivity.
Discover more essential project management charts to help you visualize every element of your strategic planning.
Ishikawa Diagram Template
Download an Ishikawa Diagram Template in
Excel
| Google Sheets
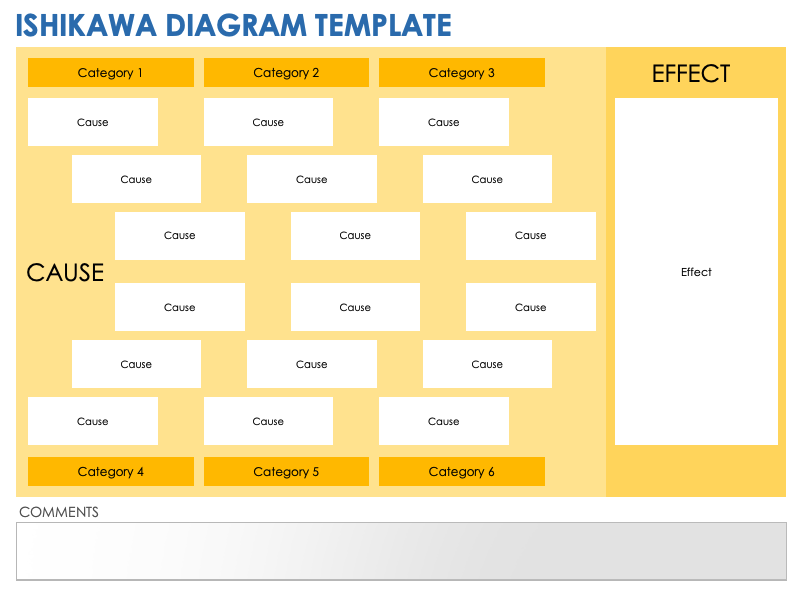
When to Use This Template: Utilize this template to understand complex problems, particularly in areas of quality assurance and improvement. Trace a problem back through the processes and contributing factors that led to a customer complaint, quality control failure, or other issues.
Notable Template Features: The template provides a detailed structure to guide users through a problem’s contributing factors, from broader categories to more focused primary and secondary causes. You can drill down to find root causes and visually map out critical areas of concern.
Learn more about continuous quality improvement (CQI) and how to use data to enhance your performance management.
Timeline Fishbone Diagram Template
Download a Timeline Fishbone Diagram Template in
PowerPoint
| Google Slides
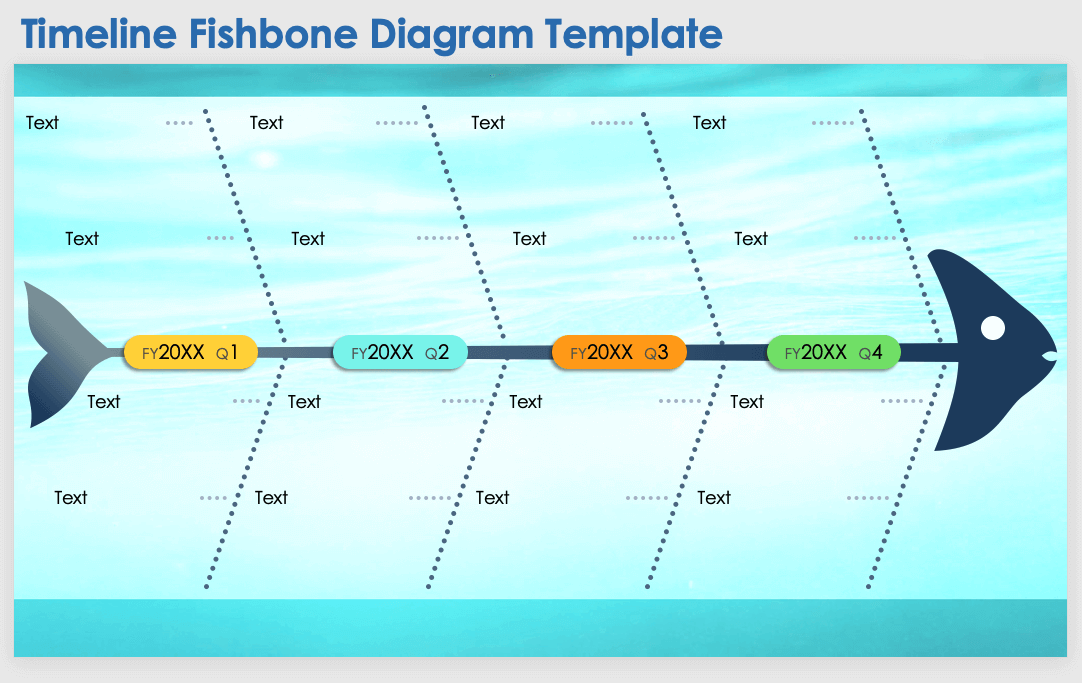
When to Use This Template: Use this template when you need to present long-term projects and processes in strategic planning sessions or annual reviews, or to show the progression of causes and their impacts over an extended period of time.
Notable Template Features: This timeline fishbone chart enables you to clearly visualize cause-and-effect relationships across a four-year span. You can analyze key events and decisions that have shaped the current state of affairs, as well as gain a deeper understanding of patterns and trends.
4 Ss Fishbone Diagram Template
Download a 4 Ss Fishbone Diagram Template in
Excel
|
Adobe PDF
| Google Sheets
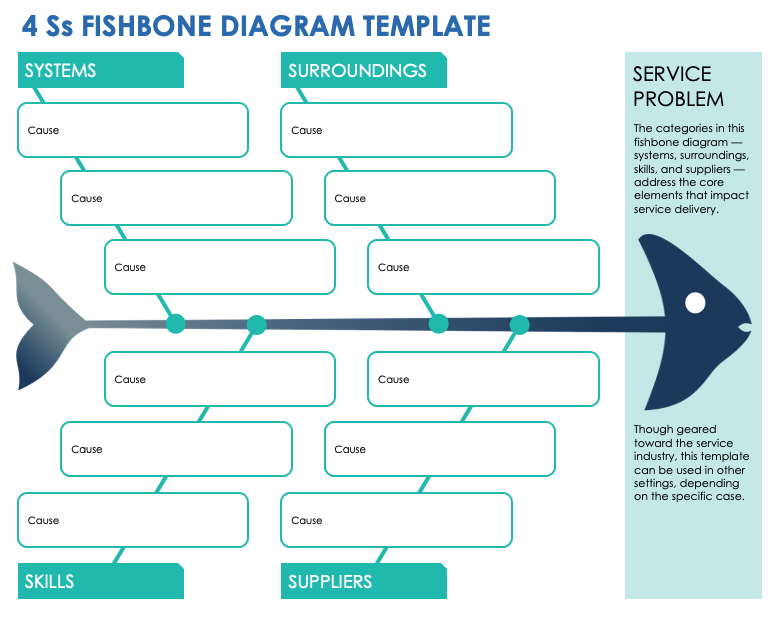
When to Use This Template: During collaborative team meetings, use this template to help you identify service problems and pinpoint the underlying issues leading to delivery failures or dips in customer satisfaction.
Notable Template Features: The template divides potential causes into commonly used service industry categories: systems, surroundings, skills, and suppliers (4 Ss). The diagram prompts users to break down each category into more granular elements, encouraging teams to delve deeper into the systemic issues that might affect service quality.
Manufacturing Fishbone Diagram Template
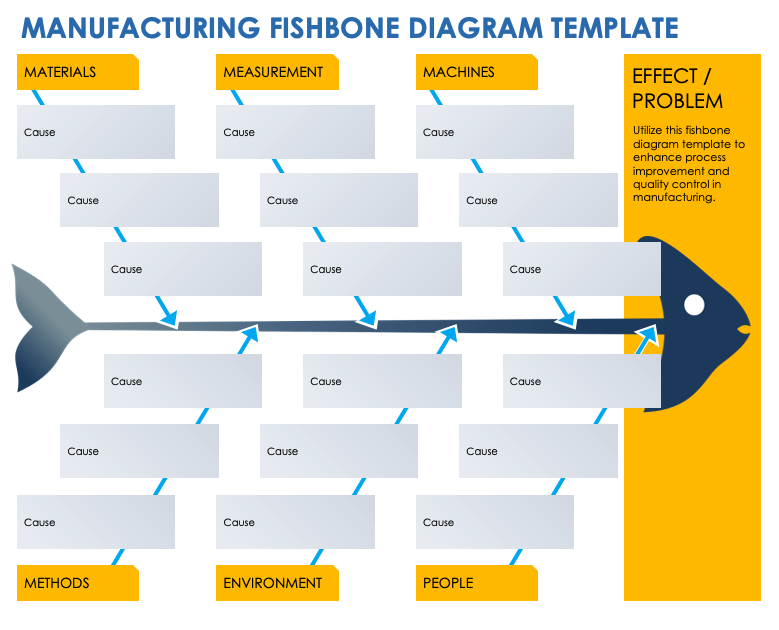
Download a Manufacturing Fishbone Diagram Template in
Excel
| Google Sheets
When to Use This Template: Teams in quality control, production, and process improvement can use this template to help identify the potential causes of production delays, defects, and other manufacturing problems.
Notable Template Features: The template provides categories relevant to manufacturing: materials, measurement, machines, methods, environment, and people. It enables teams to trace a problem, from its symptoms back to its root causes, by examining each aspect of the production process.
Whiteboard Fishbone Diagram Template
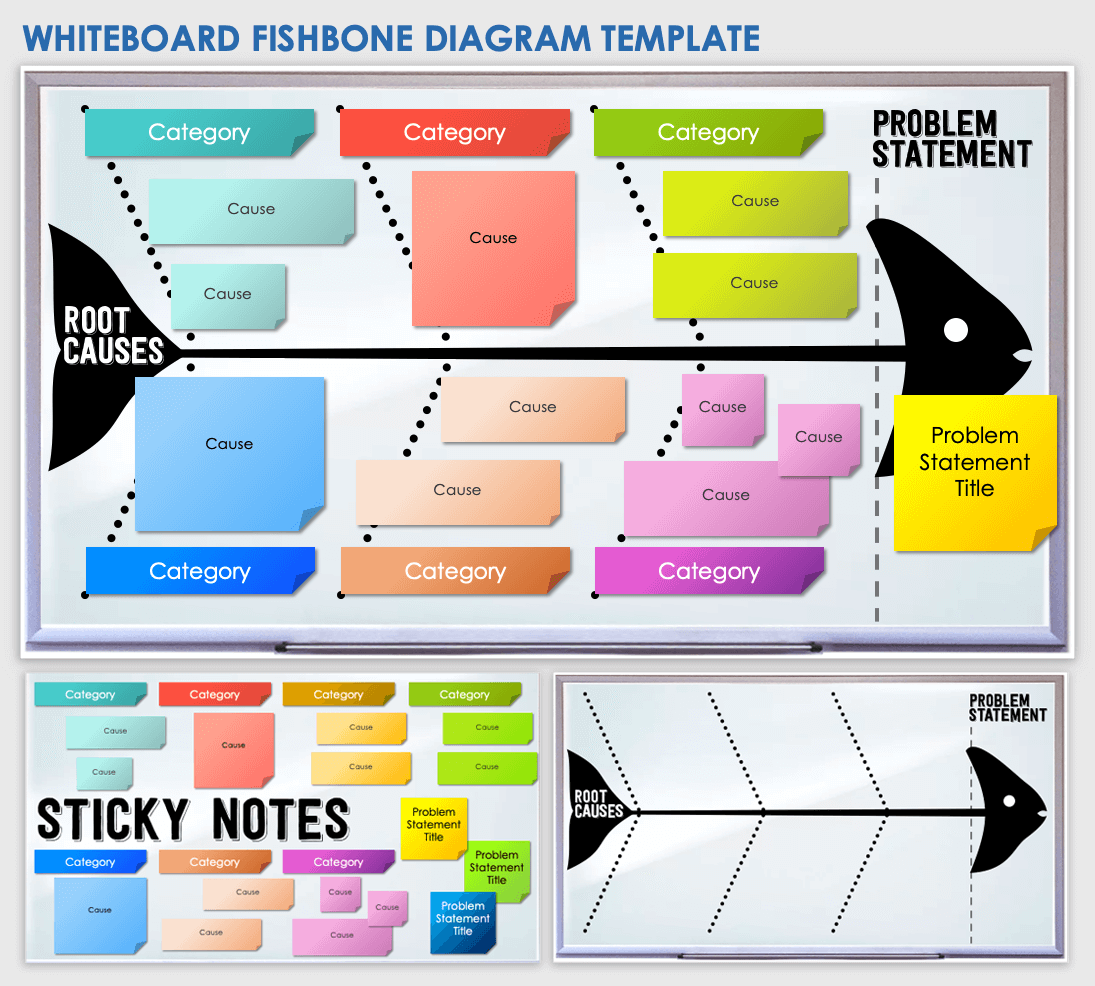
Download a Whiteboard Fishbone Diagram Template in
PowerPoint
| Google Slides
When to Use This Template: Teams who want a dynamic approach to root cause analysis can use this fishbone template during interactive problem-solving sessions that require brainstorming and collaboration.
Notable Template Features: Styled like a whiteboard, this template uses color-coded sticky notes to represent potential causes. The clear, organized layout streamlines complex discussions and encourages an engaging, cooperative approach to identifying issues.
Discover more useful root cause analysis templates in different formats for problems of varying complexity.
Empty Fishbone Chart Template
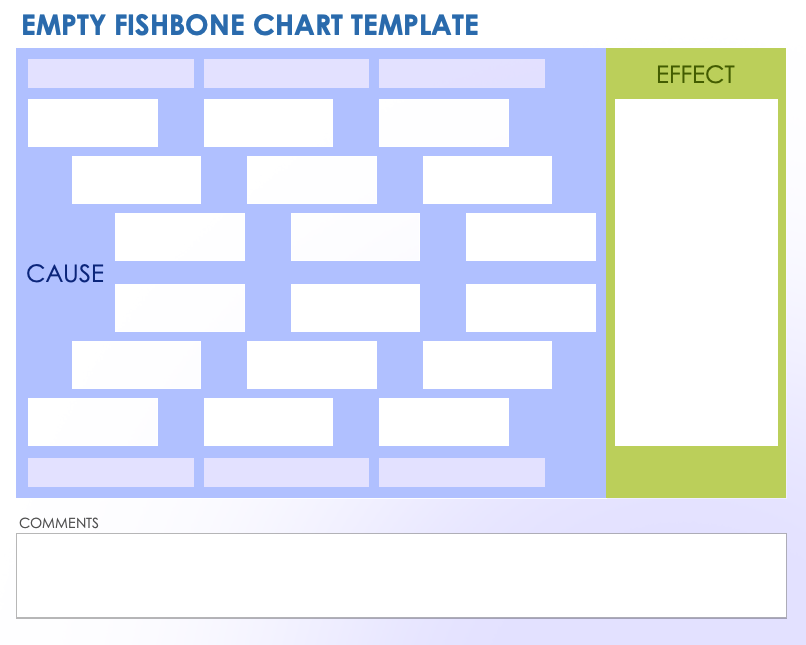
Download an Empty Fishbone Chart Template in
Excel
|
Adobe PDF
| Google Sheets
When to Use This Template: Opt for this basic fishbone diagram template when you need a clean and uncluttered starting point for identifying causes of a problem. This simple template is perfect for teams new to cause-and-effect or needs analysis, as well as for anyone educating others on the analysis process.
Notable Template Features: A straightforward design ensures that the focus remains on the content rather than the format, which helps facilitators guide participants through the process. The template is adaptable for many situations, from academic settings to business meetings.
Learn more in this complete guide to gap analysis so that you can enhance your strategic planning.
Medical Fishbone Diagram Template
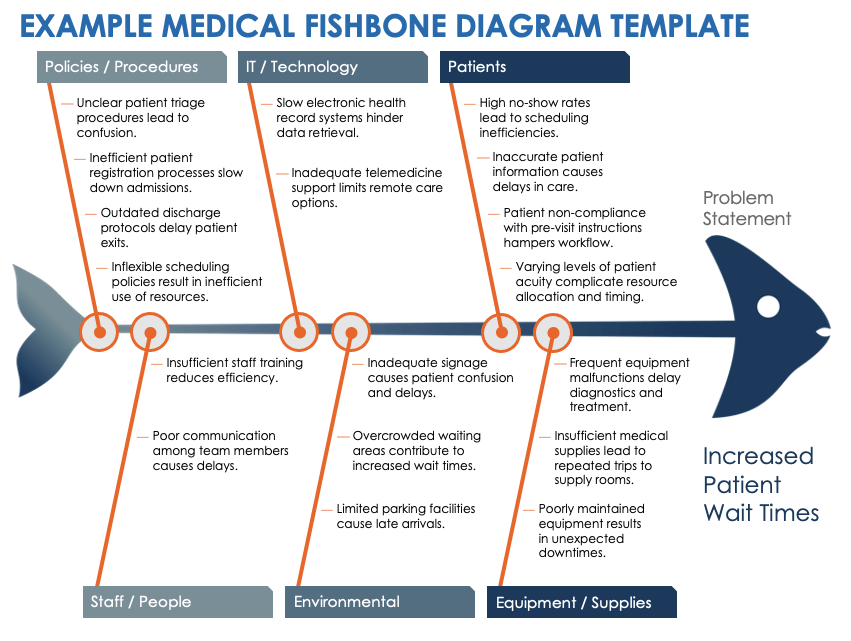
Download a Blank Medical Fishbone Diagram Template in
Microsoft Word
|
Adobe PDF
| Google Docs
Download an Example Medical Fishbone Diagram Template in
Microsoft Word
|
Adobe PDF
| Google Docs
When to Use This Template: Healthcare professionals should use this template with or without template to analyze complex patient care issues or organizational problems. It’s an ideal tool for uncovering the root causes of clinical incidents or operational inefficiencies.
Notable Template Features: The template includes key categories pertinent to the healthcare industry, such as policies, technology, patients, staff, environmental factors, and equipment and supplies. Editable fields in each category enable users to add detailed factors for a thorough exploration of possible causes contributing to the problem. Download the example template to see a sample analysis of increased patient wait times.
Full-Color Fishbone Diagram Template
Download a Full-Color Fishbone Diagram Template in
PowerPoint
| Google Slides
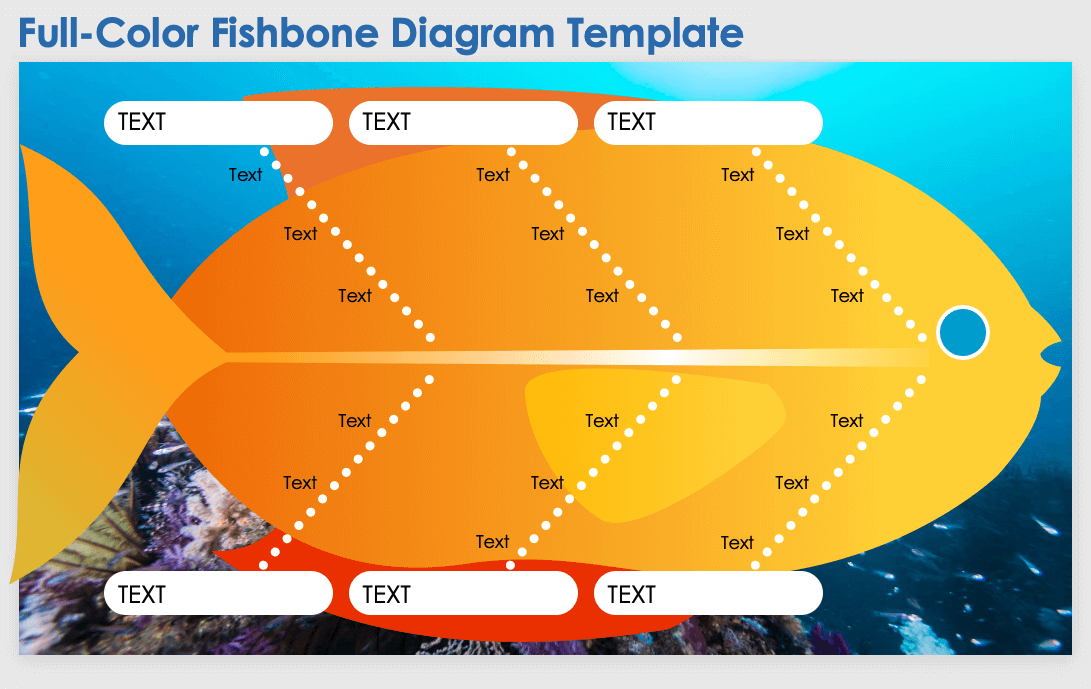
When to Use This Template: Capture the attention of an audience in environments where visual appeal is as important as the information being conveyed with this engaging template. Examine causal relationships in any context, such as business, education, or workshops.
Notable Template Features: The full-color design that makes this template visually appealing also enhances its functionality by clearly delineating different causes. This vibrant design choice makes it easier for viewers to follow along during discussions or presentations.
Simple Fishbone Diagram Template
Download a Simple Fishbone Diagram Template in
PowerPoint
| Google Slides
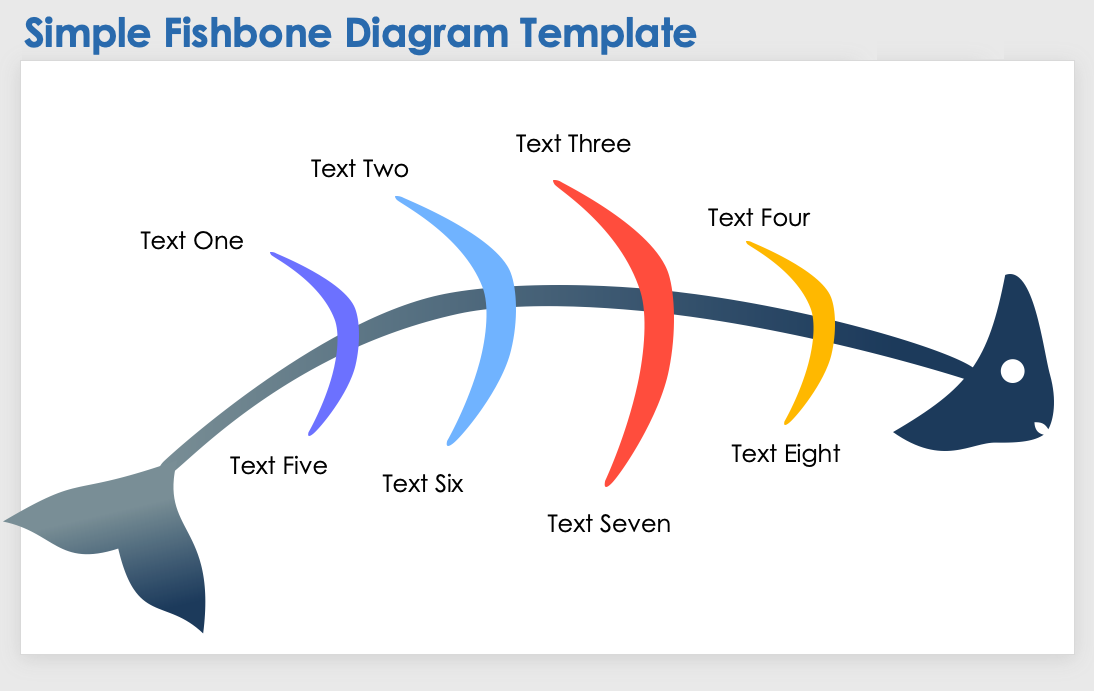
When to Use This Template: Utilize this template when you need to present a streamlined and straightforward cause-and-effect analysis. Succinctly communicate the progression of causes that contribute to a central problem.
Notable Template Features: This template's minimalist design makes it easy for users to emphasize key points, display a progression, or create a hierarchy of causes. Each bone in the diagram highlights your data, providing visual appeal without distractingly intricate graphics or lengthy text.
6 Prong Fishbone Diagram Template
Download a 6 Prong Fishbone Diagram Template in
PowerPoint
| Google Slides
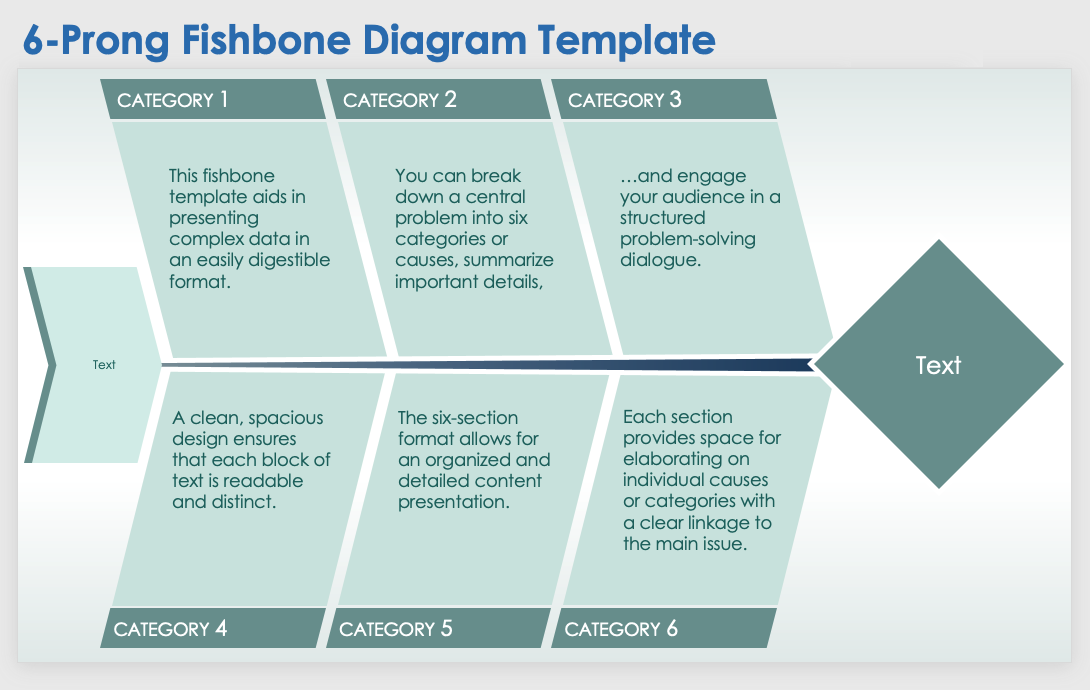
When to Use This Template: This template enables you to define, organize, and elaborate on the causes of a problem in an uncluttered format. It’s perfect for in-depth team discussions and analysis sessions.
Notable Template Features: Featuring a straightforward, clean design, the template has space for substantial blocks of text or organized bullet points. It helps users present complex information and important context in an easily digestible format.
Circles Fishbone Diagram Template
Download a Circles Fishbone Diagram Template in
PowerPoint
| Google Slides
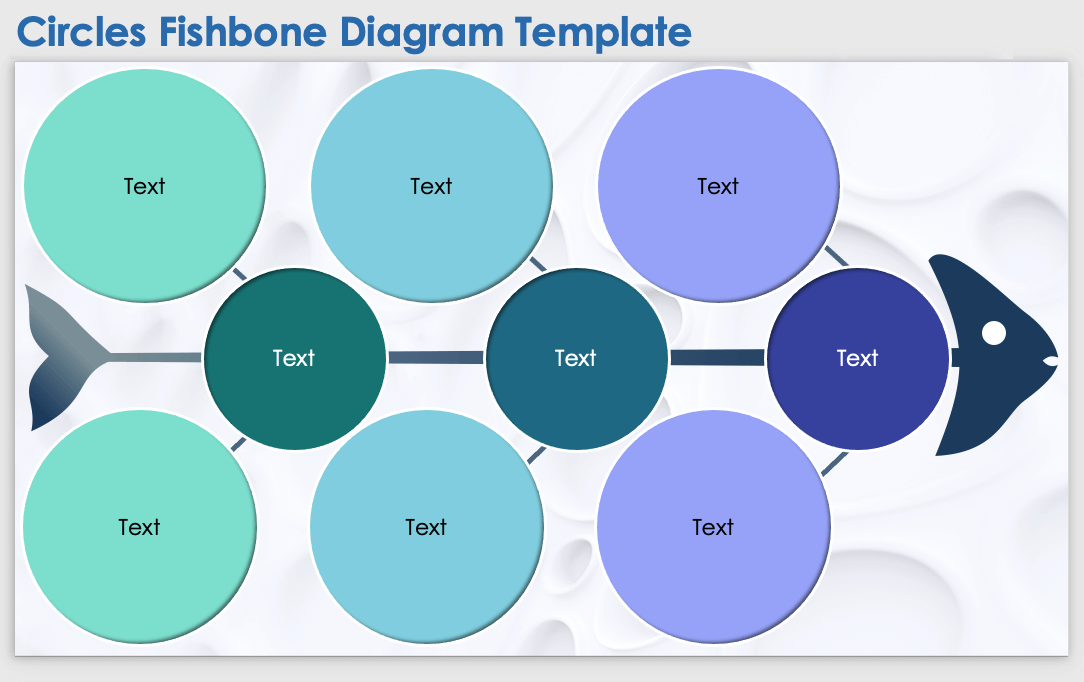
When to Use This Template: Choose this fishbone diagram template to highlight the most significant factors in a cause-and-effect analysis. It is an especially useful tool for presentations that focus on the hierarchy and interconnectivity of causes leading to a central problem.
Notable Template Features: The template uses a series of circles to draw attention to important details. This circular design helps users create an engaging visual presentation and facilitates a focused review of each element.
Triangles Fishbone Diagram Template
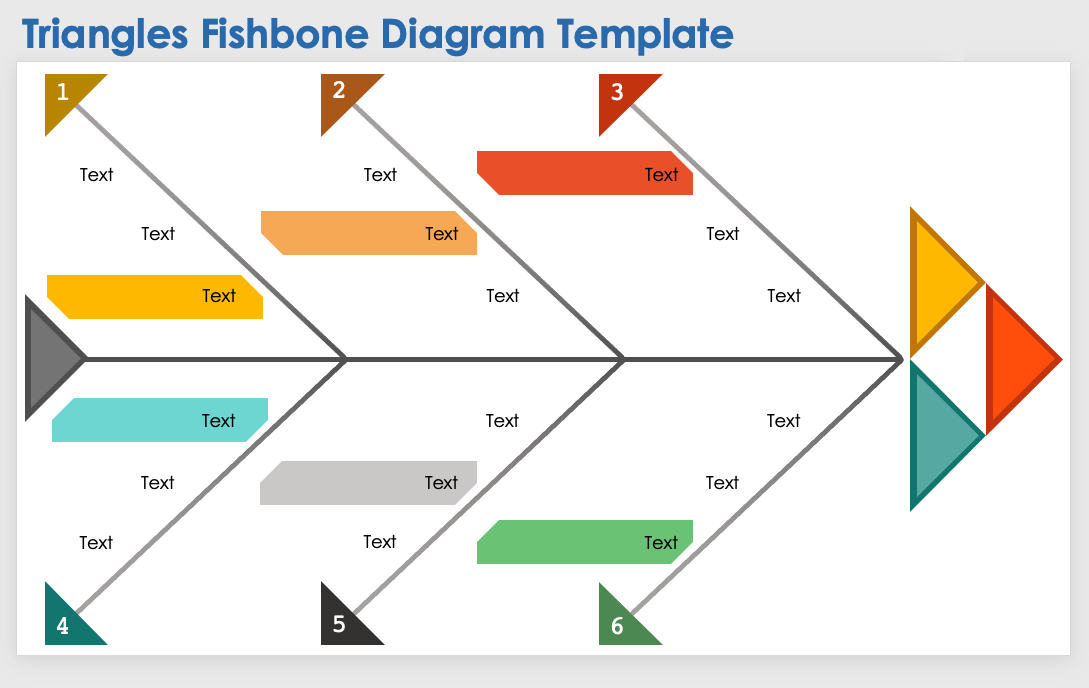
Download a Triangles Fishbone Diagram Template in
PowerPoint
| Google Slide
When to Use This Template: Create a striking presentation with this triangle fishbone diagram. Use the template as a visual aid for communicating the flow of causes leading to a particular problem or outcome.
Notable Template Features: The triangles in this template offer a distinct way for users to highlight a hierarchy of causes and guide the audience’s attention from broad factors to specific issues. The geometric design assists presenters in categorizing information clearly, enhancing audience comprehension during discussions and decision-making processes.
Discover creative problem solving techniques to enhance your organization’s decision-making and innovation.
Bold Fishbone Diagram Template
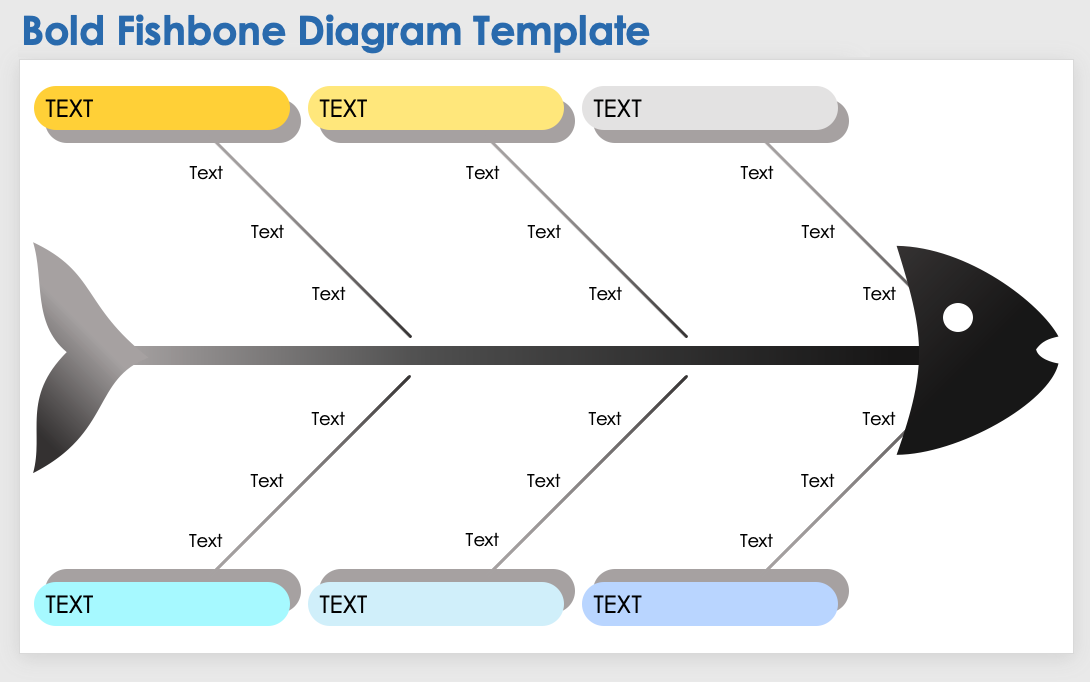
Download a Bold Fishbone Diagram Template in
PowerPoint
| Google Slides
When to Use This Template: This fishbone chart is tailor-made for situations requiring a strong visual representation of cause and effect, such as team brainstorming, problem-solving meetings, or educational presentations. The template provides a clear framework for communicating the events leading to a particular outcome.
Notable Template Features: Bold lines clearly separate each category, enhancing the visual distinction between different levels of information. With prominent headings and ample space for text, this template is a practical tool for emphasizing key details and facilitating a comprehensive, memorable analysis of each element.
For more free templates, see our fishbone diagram collections for Microsoft Word, Excel, and PowerPoint.
Get to the Root Cause of Your Business Issues with Smartsheet
Empower your people to go above and beyond with a flexible platform designed to match the needs of your team — and adapt as those needs change. The Smartsheet platform makes it easy to plan, capture, manage, and report on work from anywhere, helping your team be more effective and get more done. Report on key metrics and get real-time visibility into work as it happens with roll-up reports, dashboards, and automated workflows built to keep your team connected and informed. When teams have clarity into the work getting done, there’s no telling how much more they can accomplish in the same amount of time. Try Smartsheet for free, today.