PowerPoint Cost-Benefit Analysis Template
Download the Cost-Benefit Analysis Template for PowerPoint
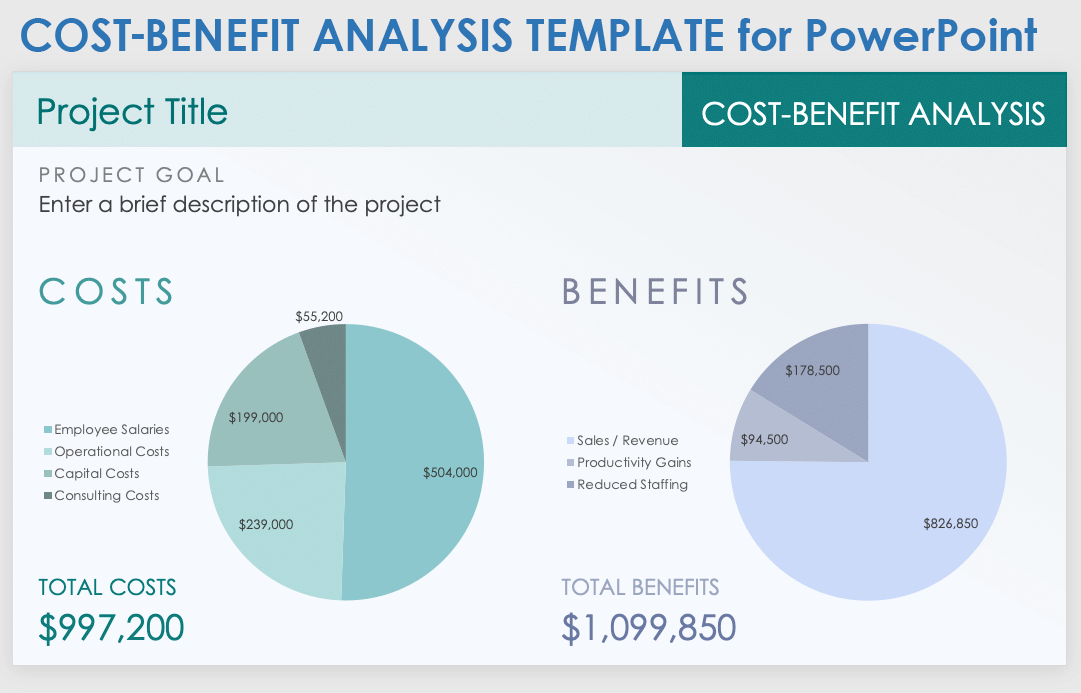
Use this cost-benefit analysis template to clearly illustrate whether the benefits outweigh the costs of your proposed project. The pie charts offer a high-level overview, while the table provides space to break down the specific details of your costs and benefits. The dashboard layout of this template offers an easy-to-digest visual impact so that shareholders can make a well-informed financial decision.
Learn from experts about when and how to use a cost-benefit analysis.
PowerPoint Cost-Benefit Analysis Table Template
Download the Cost-Benefit Analysis Table Template for PowerPoint
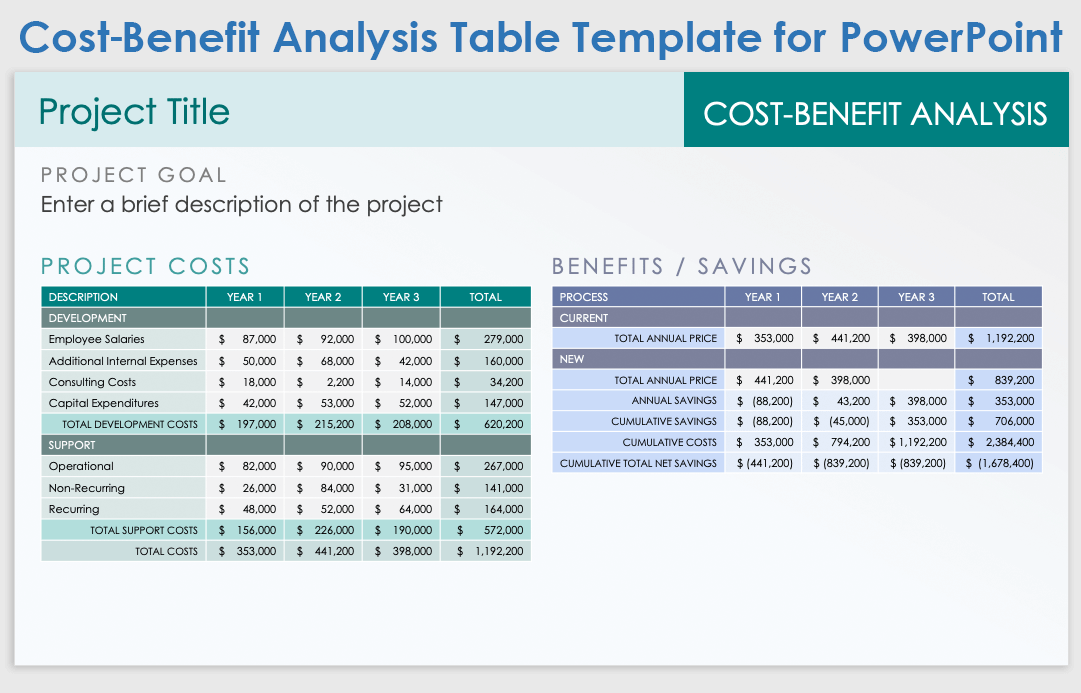
If you are a project manager who needs to show the financial implications of a proposed project, this template with its table format is the perfect tool. Enter and add the values for the project costs and benefits/savings over a three-year timeline. The template automatically calculates the totals, making it easy to use. The projections shown on the completed template offer an easy way for stakeholders to understand the project’s financial risks and rewards quickly.
PowerPoint Cost-Benefit Template
Download the Blank Cost-Benefit Template for PowerPoint
Download the Sample Cost-Benefit Template for PowerPoint
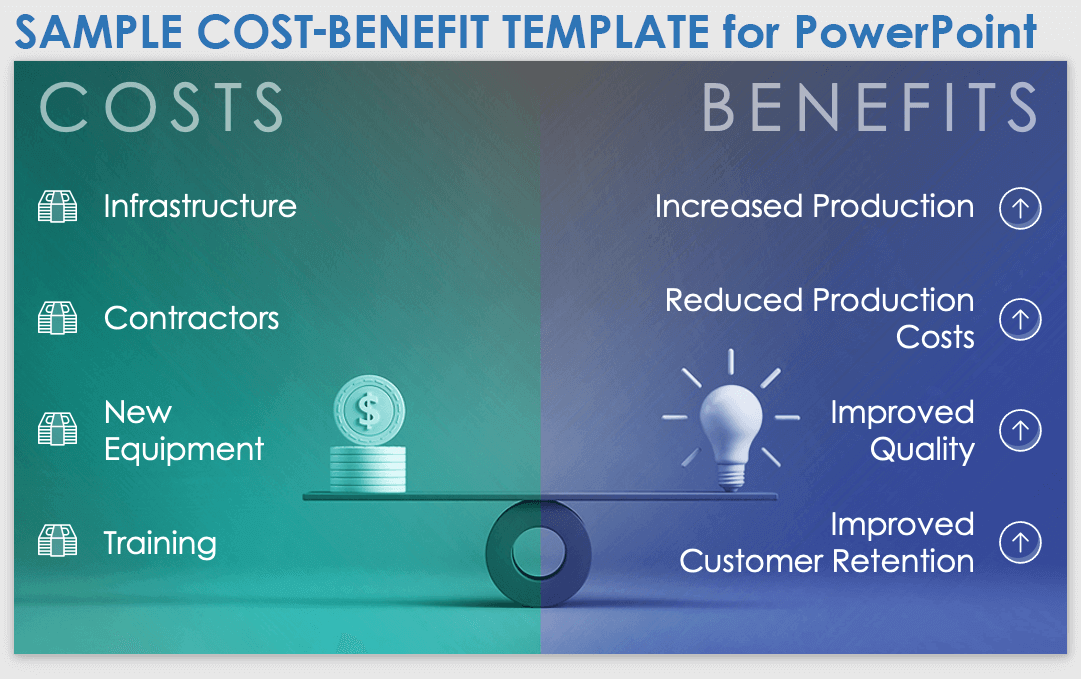
This cost-benefit template, available with or without sample data, provides a straightforward and effective explanation of your project’s expenses and savings. Add the costs and benefits to create a visual impact of the comparisons. Share the completed slide with team members and stakeholders to inform them of the monetary elements of the proposed project. You can also easily add the slide to an existing PowerPoint presentation for an upcoming project.
PowerPoint Example Cost-Benefit Analysis Template
Download the Blank Cost-Benefit Analysis Template for PowerPoint
Download the Example Cost-Benefit Analysis Template with Sample Data for PowerPoint
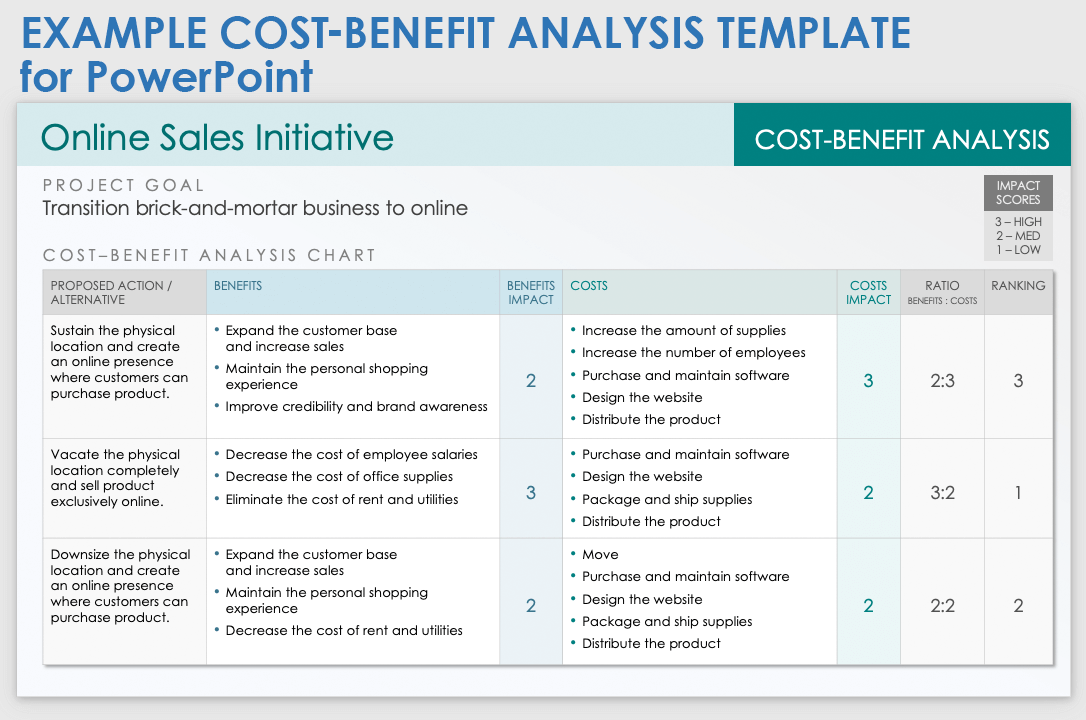
This cost-benefit analysis example template, available with or without sample data, allows you to compare options of your proposed project against alternative options. List the benefits of each option, then rank its impact as high, medium, or low. Do the same with the costs. Use the ratio column to show the weighted proportion between the cost and benefits. Share this slide with stakeholders to illustrate how other options rate to help determine which option is the best.
How to Make a Cost-Benefit Analysis in PowerPoint
Download a PowerPoint cost-benefit analysis template. Enter the details for the costs and benefits. Make any adjustments and review the results.
Use the following step-by-step guide to download, open, and complete the cost-benefit analysis template:
- Download and open the cost-benefit analysis template for PowerPoint .
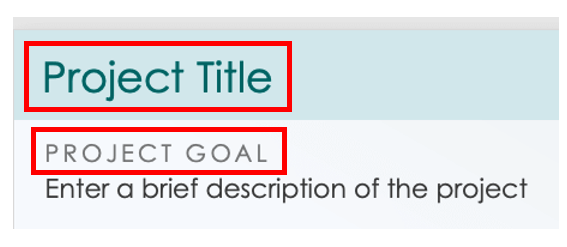
- Click the second slide. Click on Project Title and enter a name. Click on Project Goal and enter text. Enter a brief description of the project in the allotted space.
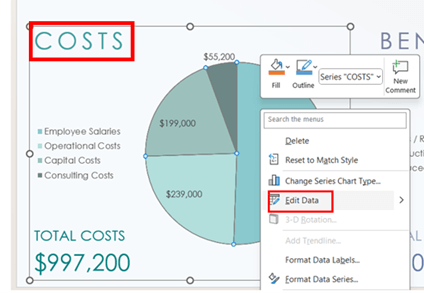
- Click on the Costs pie chart and right-click. Select Edit Data.
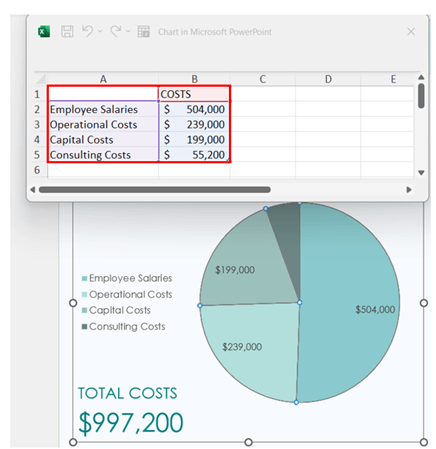
- An Excel spreadsheet will open containing the date for the pie chart. Edit the text and numerical values. The data will update on the Costs pie chart on the PowerPoint slide. Close the Excel spreadsheet when complete.
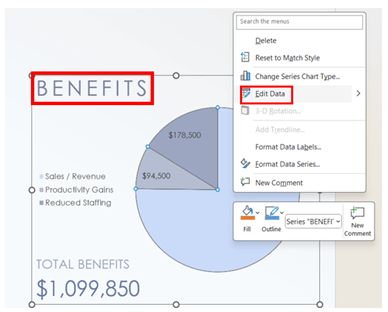
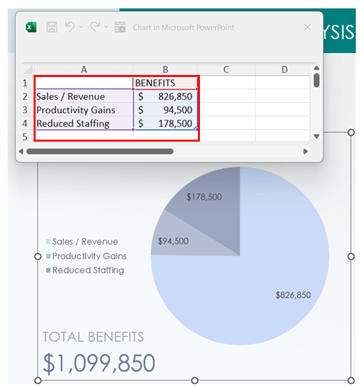
- Click on the Benefits pie chart and right-click. Select Edit Data.
- An Excel spreadsheet will open containing the date for the pie chart. Edit the text and numerical values. The data will update on the Benefits pie chart on the PowerPoint slide. Close the Excel spreadsheet when complete.
What Should Be Included in a Cost-Benefit Analysis When Using PowerPoint
A cost-benefit analysis in PowerPoint should include high-level, easy-to-read data. It should also state the goal and list options. Since it’s a slide, it should be clear and concise, and you should avoid clutter.
Be sure to include these details:
- A Brief Explanation of Your Project Goal: This copy provides context for the data that follows so stakeholders can understand the project’s scope.
- An Easy-to-Read Font Size: Use text sparingly with a font that is easy to read. Avoid excessive text, as it can distract from and dilute key details.
- An Overview of the Costs and Benefits: Use short lists or tables to illustrate the costs and benefits. Keep the information high-level so stakeholders can easily absorb the information.
- Options: Include one or two options to illustrate alternative scenarios. This comparison method helps guide the decision-making process.
- A Visual Representation of the Costs and Benefits: Keep visuals simple and clear. A pie chart is always a good option for a visual aid.
How to Present a Cost-Benefit Analysis Using PowerPoint
Utilize a PowerPoint slide structure that works best for your situation or industry. Add the vital data and include a table or chart to visually represent costs. Incorporate any recommendations based on the analysis at the end of the presentation.
Follow these steps to ensure you include the necessary elements so that stakeholders are well-informed about whether or not to pursue your proposed project. Here’s a high-level overview of how to present a cost-benefit analysis using PowerPoint:
- Identify Parameters: Parameters include scope, quality, and timeline. Introducing these first will reveal that the project is set up for success.
- List Costs and Benefits: Costs and benefits should be distinguished by two separate lists. Organize them by type, such as capital costs and operational savings.
- Compare Costs and Benefits: Use ratios for an evidence-based comparison of the costs and benefits.
- Analyze Results and Make a Recommendation: Use the data in the presentation to recommend the best financially sound decision.
Take Action on Your Cost-Benefit Analysis with Effective Project Management in Smartsheet
From simple task management and project planning to complex resource and portfolio management, Smartsheet helps you improve collaboration and increase work velocity -- empowering you to get more done.
The Smartsheet platform makes it easy to plan, capture, manage, and report on work from anywhere, helping your team be more effective and get more done. Report on key metrics and get real-time visibility into work as it happens with roll-up reports, dashboards, and automated workflows built to keep your team connected and informed.
When teams have clarity into the work getting done, there’s no telling how much more they can accomplish in the same amount of time. Try Smartsheet for free, today.
